The OGA Blogs
Archive for
NHL Predictive Analysis – 30 January
(If you regularly read this NHL analysis, start under the title “The 30 January Chart,” and don’t miss the ending section “What Do We Already Know?”.)
Below is your NHL Point Predictor and Playoff Qualifying Curve (PQC) update for NHL games ending Wednesday, 30 January. What are we showing here? Where the NHL is going, not where they are after the last games played.
How Will We Do It? Check back here daily as we provide you the simple chart below where you can follow the NHL’s projected standings leading up to the Playoffs. The chart tells you two things: each team’s finishing points based on current play projected over the 48 game season; and our PQC calls as every team reaches each 10-game marker (i.e. Game 10, 21, 30, etc.). As teams’ PQC calls change, their standings’ line color changes to the appropriate PQC designation as explained below.
The 30 January Chart
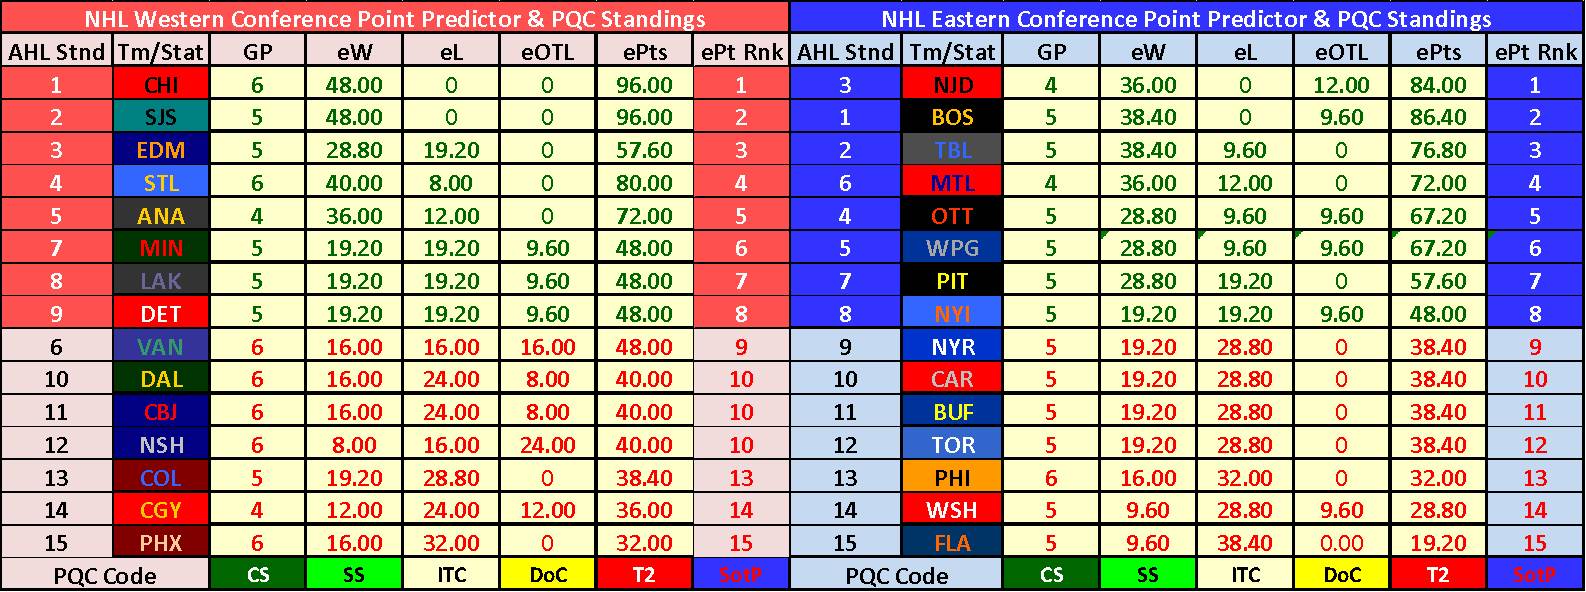
Here are the two Conferences’ projected, final standings points after games completed on 30 January:

From or current chart, it looks like it will take at least 24 wins / 48 points in the Eastern Conference and 27.5 wins / 55 points in the Western Conference to qualify for the playoffs. These numbers will become more accurate as more games conclude and each team lands at least one OT/SOL.
Here are notes to explain the chart:
1. NHL Conferences are shown Western and Eastern from left to right as they would be on a map. The far left column in each chart titled ‘NHL Stnd’ indicates current team NHL standings as of the posted date. And teams use standard NHL abbreviations and color schemes.
2. ‘GP’ = Games Played.
3. ‘eW’ = Estimated Wins, our own formulary as the season progresses.
4. ‘eL’ = Estimated Losses
5. ‘eOTL’ = Estimated Overtime Losses, the third point in three-point games
6. ‘ePts’ = Estimated Points
7. ‘ePt Rnk’ = Estimated Points Rank, our order of how they will fare overall
8. And the ‘PQC Code’: ‘CS’ = Chasing Stanley, or IN the Playoffs; ‘SS’ = Sharpening Skates, or just shy of IN the Playoffs; ‘ITC’ = In The Curve, or playing right about on average; ‘DoC’ = Dusting Off Clubs, or almost OUT of the Playoffs; ‘T2’ = Tee Time, or OUT of the Playoffs; and ‘SotP’ = Shot Off The Post, or a bad call of CC or T2. Remember, the PQC Codes get called every 10 games.
“What Do We Already Know?”
The first G10 calls will be Dallas and Phoenix on Monday, 4 February. The final G10 call is on Monday, 11 February when Calgary plays its 10th game against Minnesota. Here are a couple of other notes:
And we already know 22 – of – 30 / 73.3% of NHL clubs cannot be CC teams by G10.
Eastern Conference PQC and Stats
From the chart below, you can see several things. Firstly, only four (down from five) of the Eastern teams still have a shot at a Chasing Stanley (CS) call. One more cannot surpass a call of Sharpening Skates (SS), or just shy of making the Playoffs this season. The other 10 cannot be better than In The Curve (ITC). And seven teams as listed won’t be eliminated come the G10 mark.

Projected top stats for forwards, defensemen and goalies in the East are:

Western Conference PQC and Stats
We equal or surpass the G5 mark for the Western Conference tonight, so initial G10 PQC calls are still firming up. At this point, however, we already know eight (up from six) teams won’t be eliminated come G10.
And projected stats in the West are:

Summary
This is the updated NHL Point Predictor and PQC Standings chart based on games ending 30 January. We already know a total of 14 teams won’t be eliminated from the Playoffs by Game 10. We also know, however, that 22 teams / 73.3% of the NHL cannot reach a call of Chasing Stanley at that same mark.
Your next update will be posted after games played on Thursday, 31 January.
Go to the bottom of the right hand column, load in your email address and click on the ‘Sign Me Up!’ button to subscribe to the OGA Blogs and you will not miss an NHL update (and the NHL ones when/if they come to an agreement.)
NHL Predictive Analysis – 29 January
(If you regularly read this NHL analysis, start under the title “The 29 January Chart,” and don’t miss the ending section “What Do We Already Know?”.)
Below is your NHL Point Predictor and Playoff Qualifying Curve (PQC) update for NHL games ending Tuesday, 29 January. What are we showing here? Where the NHL is going, not where they are after the last games played.
How Will We Do It? Check back here daily as we provide you the simple chart below where you can follow the NHL’s projected standings leading up to the Playoffs. The chart tells you two things: each team’s finishing points based on current play projected over the 48 game season; and our PQC calls as every team reaches each 10-game marker (i.e. Game 10, 21, 30, etc.). As teams’ PQC calls change, their standings’ line color changes to the appropriate PQC designation as explained below.
The 29 January Chart
Here are the two Conferences’ projected, final standings points after games completed on 29 January:

Projections will continue to gain more accuracy as teams cross the Game 10 (G10) mark and experience their first OT/SOL. However, you can begin to see that we will have some close competition in the 6th through 10th seeds for the final two positions.
Here are notes to explain the chart:
1. NHL Conferences are shown Western and Eastern from left to right as they would be on a map. The far left column in each chart titled ‘NHL Stnd’ indicates current team NHL standings as of the posted date. And teams use standard NHL abbreviations and color schemes.
2. ‘GP’ = Games Played.
3. ‘eW’ = Estimated Wins, our own formulary as the season progresses.
4. ‘eL’ = Estimated Losses
5. ‘eOTL’ = Estimated Overtime Losses, the third point in three-point games
6. ‘ePts’ = Estimated Points
7. ‘ePt Rnk’ = Estimated Points Rank, our order of how they will fare overall
8. And the ‘PQC Code’: ‘CS’ = Chasing Stanley, or IN the Playoffs; ‘SS’ = Sharpening Skates, or just shy of IN the Playoffs; ‘ITC’ = In The Curve, or playing right about on average; ‘DoC’ = Dusting Off Clubs, or almost OUT of the Playoffs; ‘T2’ = Tee Time, or OUT of the Playoffs; and ‘SotP’ = Shot Off The Post, or a bad call of CC or T2. Remember, the PQC Codes get called every 10 games.
“What Do We Already Know?”
The first G10 calls will be Dallas and Phoenix on Monday, 4 February. The final G10 call is on Monday, 11 February when Calgary plays its 10th game against Minnesota. Here are a couple of other notes:
And we already know 21 – of – 30 NHL clubs cannot be CC teams by G10.
Eastern Conference PQC and Stats
We equalled or surpassed the G5 mark for the Eastern Conference so have the initial G10 PQC calls firming up. From the chart below, you can see several things. Firstly, only five of the Eastern teams still have a shot at a Chasing Stanley (CS) call. The other 10 cannot be better than In The Curve (ITC). And seven teams as listed won’t be eliminated come the G10 mark.

Projected top stats for forwards, defensemen and goalies in the East are:

Western Conference PQC and Stats
We equal or surpass the G5 mark for the Western Conference on Thursday, so initial G10 PQC calls are still firming up. At this point, however, we already know six teams won’t be eliminated come G10.
The projected stats in the West are:

Summary
This is the updated NHL Point Predictor and PQC Standings chart based on games ending 29 January. We already know a total of 13 teams won’t be eliminated from the Playoffs by Game 10. We also know, however, that 21 teams / 70% of the NHL cannot reach a call of Chasing Stanley at that same mark.
Your next update will be posted after games played on Wednesday, 30 January.
Go to the bottom of the right hand column, load in your email address and click on the ‘Sign Me Up!’ button to subscribe to the OGA Blogs and you will not miss an NHL update (and the NHL ones when/if they come to an agreement.)
NHL Predictive Analysis – 28 January
(If you regularly read this NHL analysis, start under the title “The 28 January Chart,” and don’t miss the ending section “What Do We Already Know?”.)
Below is your NHL Point Predictor and Playoff Qualifying Curve (PQC) update for NHL games ending Sunday, 28 January. What are we showing here? Where the NHL is going, not where they are after the last games played.
How Will We Do It? Check back here daily as we provide you the simple chart below where you can follow the NHL’s projected standings leading up to the Playoffs. The chart tells you two things: each team’s finishing points based on current play projected over the 48 game season; and our PQC calls as every team reaches each 10-game marker (i.e. Game 10, 21, 30, etc.). As teams’ PQC calls change, their standings’ line color changes to the appropriate PQC designation as explained below.
The 28 January Chart
Here are the two Conferences’ projected, final standings points after games completed on 28 January:
As you can see, we are already beginning to have some differences between projected finishes and current standings in terms of positional rank. These differences are more pronounced where we have a difference in the number of games played between teams in each Conference. Projections will gain more accuracy as teams cross the Game 10 (G10) mark and experience their first OT/SOL.
Here are notes to explain the chart:
1. NHL Conferences are shown Western and Eastern from left to right as they would be on a map. The far left column in each chart titled ‘NHL Stnd’ indicates current team NHL standings as of the posted date. And teams use standard NHL abbreviations and color schemes.
2. ‘GP’ = Games Played.
3. ‘eW’ = Estimated Wins, our own formulary as the season progresses.
4. ‘eL’ = Estimated Losses
5. ‘eOTL’ = Estimated Overtime Losses, the third point in three-point games
6. ‘ePts’ = Estimated Points
7. ‘ePt Rnk’ = Estimated Points Rank, our order of how they will fare overall
8. And the ‘PQC Code’: ‘CS’ = Chasing Stanley, or IN the Playoffs; ‘SS’ = Sharpening Skates, or just shy of IN the Playoffs; ‘ITC’ = In The Curve, or playing right about on average; ‘DoC’ = Dusting Off Clubs, or almost OUT of the Playoffs; ‘T2’ = Tee Time, or OUT of the Playoffs; and ‘SotP’ = Shot Off The Post, or a bad call of CC or T2. Remember, the PQC Codes get called every 10 games.
“What Do We Already Know?”
The first G10 calls will be Dallas and Phoenix on Monday, 4 February. The final G10 call is on Monday, 11 February when Calgary plays its 10th game against Minnesota. Here are a couple of other notes:
The AHL has just about surpassed the 40–game mark for all teams. At this point, we know through our AHL Playoff Qualifying Curve nine teams will be in the Calder Cup Playoffs and seven others will not. This leads us to believe the NHL at G40 may also be decided from a PQC standpoint somewhere in the neighborhood of 60%, a number that is about normal at that point in an 82–game season. Expect around 18 – 20 teams’ fates decided by the G40 mark and the rest to come up quickly over the remaining eight games of the season.
Were the season to end tonight, it is interesting to note that the 6th through 9th seeds in the Western Conference are determined by tie-breakers.
Reference Win, Loss or OTL streaks… See our blog “Opening Streaks” and read how potentially, one-third of the NHL’s playoff fate may have been decided for teams after only three games. (See https://ongoalanalysis.wordpress.com/2013/01/25/opening-streaks/)
We refrain from G10 predictions until at least all G5s have played out. We arrive at that point on the schedule in Montreal and New Jersey on 29 January in the Eastern Conference and for Calgary on 31 January out West. Thereafter, expect a G10 prediction graphic added along with each conference’s projected stats below.
And we already know 20 – of – 30 NHL clubs cannot be CC teams by G10. We also know five Eastern and three Western teams will not be eliminated from a potential playoff appearance by G10.
Projected top stats for forwards, defensemen and goalies in the East are:

Those stats in the West are:

For projected statistics, we need between five and 10 games for a more accurate picture here. Projected (“Projec”) numbers continue to trend downward toward a more realistic, final projection, however.
Summary
This is the updated NHL Point Predictor and PQC Standings chart based on games ending 28 January.
Your next update will be posted after games played on Tuesday, 29 January.
Go to the bottom of the right hand column, load in your email address and click on the ‘Sign Me Up!’ button to subscribe to the OGA Blogs and you will not miss an NHL update (and the NHL ones when/if they come to an agreement.)
NHL Predictive Analysis – 27 January
(If you regularly read this NHL analysis, start under the title “The 27 January Chart,” and don’t miss the ending section “What Do We Already Know?”.)
Below is your NHL Point Predictor and Playoff Qualifying Curve (PQC) update for NHL games ending Sunday, 27 January. What are we showing here? Where the NHL is going, not where they are after the last games played.
How Will We Do It? Check back here daily as we provide you the simple chart below where you can follow the NHL’s projected standings leading up to the Playoffs. The chart tells you two things: each team’s finishing points based on current play projected over the 48 game season; and our PQC calls as every team reaches each 10-game marker (i.e. Game 10, 21, 30, etc.). As teams’ PQC calls change, their standings’ line color changes to the appropriate PQC designation as explained below.
The 27 January Chart
Here are the two Conferences’ projected, final standings points after games completed on 27 January:

As you can see, we are already beginning to have some differences between projected finishes and current standings in terms of positional rank. These differences are more pronounced where we have a difference in the number of games played between teams in each Conference. Projections will gain more accuracy as teams cross the Game 10 (G10) mark and experience their first OT/SOL.
Here are notes to explain the chart:
1. NHL Conferences are shown Western and Eastern from left to right as they would be on a map. The far left column in each chart titled ‘NHL Stnd’ indicates current team NHL standings as of the posted date. And teams use standard NHL abbreviations and color schemes.
2. ‘GP’ = Games Played.
3. ‘eW’ = Estimated Wins, our own formulary as the season progresses.
4. ‘eL’ = Estimated Losses
5. ‘eOTL’ = Estimated Overtime Losses, the third point in three-point games
6. ‘ePts’ = Estimated Points
7. ‘ePt Rnk’ = Estimated Points Rank, our order of how they will fare overall
8. And the ‘PQC Code’: ‘CS’ = Chasing Stanley, or IN the Playoffs; ‘SS’ = Sharpening Skates, or just shy of IN the Playoffs; ‘ITC’ = In The Curve, or playing right about on average; ‘DoC’ = Dusting Off Clubs, or almost OUT of the Playoffs; ‘T2’ = Tee Time, or OUT of the Playoffs; and ‘SotP’ = Shot Off The Post, or a bad call of CC or T2. Remember, the PQC Codes get called every 10 games.
“What Do We Already Know?”
The first G10 calls will be Dallas and Phoenix on Monday, 4 February. The final G10 call is on Monday, 11 February when Calgary plays its 10th game against Minnesota. Here are a couple of other notes:
The AHL has just about surpassed the 40–game mark for all teams. At this point, we know through our AHL Playoff Qualifying Curve nine teams will be in the Calder Cup Playoffs and seven others will not. Even if we juggle our models just a bit and recalculate who will be in or out, we only come up with one additional team decided. This leads us to believe the NHL at Game 40 may also be decided from a PQC standpoint somewhere in the neighborhood of 60%, a number that is about normal at that point in an 82–game season. So expect around 18 – 20 teams’ fates decided by the G40 mark and the rest to come up quickly over the remaining eight games of the season.
Were the season to end tonight, it is interesting to note that 8th and 9th seeds in the Eastern Conference, and 6th through 11th seeds in the West are determined by tie-breakers.
Reference Win, Loss or OTL streaks… See our blog “Opening Streaks” and read how potentially, one-third of the NHL’s playoff fate may have been decided for teams after only three games. (See https://ongoalanalysis.wordpress.com/2013/01/25/opening-streaks/)
We refrain from G10 predictions until at least all G5s have played out. Once we hit that G5 mark, PQC projection graphics for each conference will begin running. We arrive at that point on the schedule in Montreal and New Jersey on 29 January in the Eastern Conference and for Calgary on 31 January out West.
And we already know 18 – of – 30 NHL clubs cannot be CC teams by G10. We also know five Eastern and three Western teams will not be eliminated from a potential playoff appearance by G10.
Projected top stats for forwards, defensemen and goalies in the East are:

Those stats in the West are:

For projected statistics, we need between five and 10 games for a more accurate picture here. Projected (“Projec”) numbers continue to trend downward toward a more realistic, final projection, however.
Summary
This is the updated NHL Point Predictor and PQC Standings chart based on games ending 27 January.
Your next update will be posted after games played on Monday, 28 January.
Go to the bottom of the right hand column, load in your email address and click on the ‘Sign Me Up!’ button to subscribe to the OGA Blogs and you will not miss an NHL update (and the NHL ones when/if they come to an agreement.)
NHL Predictive Analysis – 26 January
(If you regularly read this NHL analysis, start under the title “The 26 January Chart,” and don’t miss the ending section “What Do We Already Know?”.)
Below is your NHL Point Predictor and Playoff Qualifying Curve (PQC) update for NHL games ending Saturday, 26 January. What are we showing here? Where the NHL is going, not where they are after the last games played.
How Will We Do It? Check back here daily as we provide you the simple chart below where you can follow the NHL’s projected standings leading up to the Playoffs. The chart tells you two things: each team’s finishing points based on current play projected over the 48 game season; and our PQC calls as every team reaches each 10-game marker (i.e. Game 10, 21, 30, etc.). As teams’ PQC calls change, their standings’ line color changes to the appropriate PQC designation as explained below.
The 26 January Chart
Here are the two Conferences’ projected, final standings points after games completed on 26 January:

As you can see, we are already beginning to have some differences between projected finishes and current standings in terms of positional rank. These differences are more pronounced where we have a difference in the number of games played between teams in each Conference. Projections will gain more accuracy as teams cross the Game 10 (G10) mark and experience their first OT/SOL.
Here are notes to explain the chart:
1. NHL Conferences are shown Western and Eastern from left to right as they would be on a map. The far left column in each chart titled ‘NHL Stnd’ indicates current team NHL standings as of the posted date. And teams use standard NHL abbreviations and color schemes.
2. ‘GP’ = Games Played.
3. ‘eW’ = Estimated Wins, our own formulary as the season progresses.
4. ‘eL’ = Estimated Losses
5. ‘eOTL’ = Estimated Overtime Losses, the third point in three-point games
6. ‘ePts’ = Estimated Points
7. ‘ePt Rnk’ = Estimated Points Rank, our order of how they will fare overall
8. And the ‘PQC Code’: ‘CS’ = Chasing Stanley, or IN the Playoffs; ‘SS’ = Sharpening Skates, or just shy of IN the Playoffs; ‘ITC’ = In The Curve, or playing right about on average; ‘DoC’ = Dusting Off Clubs, or almost OUT of the Playoffs; ‘T2’ = Tee Time, or OUT of the Playoffs; and ‘SotP’ = Shot Off The Post, or a bad call of CC or T2. Remember, the PQC Codes get called every 10 games.
“What Do We Already Know?”
The first G10 calls will be Dallas and Phoenix on Monday, 4 February. The final G10 call is on Monday, 11 February when Calgary plays its 10th game against Minnesota. Here are a couple of other notes:
The AHL has just about surpassed the 40–game mark for all teams. At this point, we know through our AHL Playoff Qualifying Curve nine teams will be in the Calder Cup Playoffs and seven others will not. Even if we juggle our models just a bit and recalculate who will be in or out, we only come up with one additional team decided. This leads us to believe the NHL at Game 40 may also be decided from a PQC standpoint somewhere in the neighborhood of 60%, a number that is about normal at that point in an 82–game season. So expect around 18 – 20 teams’ fates decided by the G40 mark and the rest to come up quickly over the remaining eight games of the season.
Were the season to end tonight, it is interesting to note that in the Eastern Conference, 7th through 10th seeds are determined by tie-breakers. ‘Out West,’ our tie-breakers come into play between the current 6th through 11th seeds. Also, all four Eastern teams who have played five games of their schedule rest in the bottom 11th through 14th seeds. That is not the case in the Western Conference where they are spread across the standings.
Reference Win, Loss or OTL streaks… See our blog “Opening Streaks” and read how potentially, one-third of the NHL’s playoff fate may have been decided for teams after only three games. (See https://ongoalanalysis.wordpress.com/2013/01/25/opening-streaks/) The below chart shows you current streaks with Wins in green font, Losses in red font, and OT/SOL’s in black font. Where you see the dark red box for the 1st streak in Philadelphia and Washington, those equal the longest losing streak to open the 1994-5 season by any team. Teams hitting those dubious marks were at a .500 chance of even making the Playoffs that season. The lighter red box around Florida’s current four game, and Columbus’ three game losing streaks are above the high losing streaks for teams who failed to make the Playoffs in the 1994-5 season.

We refrain from G10 predictions until at least all G5’s have played out. Once we hit that G5 mark, PQC projection graphics for each conference will begin running. We arrive at that point on the schedule in Montreal and New Jersey on 29 January in the Eastern Conference and for Calgary on 31 January out West.
And we already know 11 – of – 30 NHL clubs cannot be CC teams by G10. We also know five Eastern and three Western teams will not be eliminated from a potential playoff appearance by G10.
Projected top stats for forwards, defensemen and goalies in the East are:

Those stats in the West are:

For projected statistics, we need between five and 10 games for a more accurate picture here. Projected (“Projec”) numbers continue to trend downward toward a more realistic, final projection, however.
Summary
This is the updated NHL Point Predictor and PQC Standings chart based on games ending 26 January.
Your next update will be posted after games played on Sunday, 27 January.
Go to the bottom of the right hand column, load in your email address and click on the ‘Sign Me Up!’ button to subscribe to the OGA Blogs and you will not miss an NHL update (and the NHL ones when/if they come to an agreement.)

You must be logged in to post a comment.